Diagnostics Information
Overview
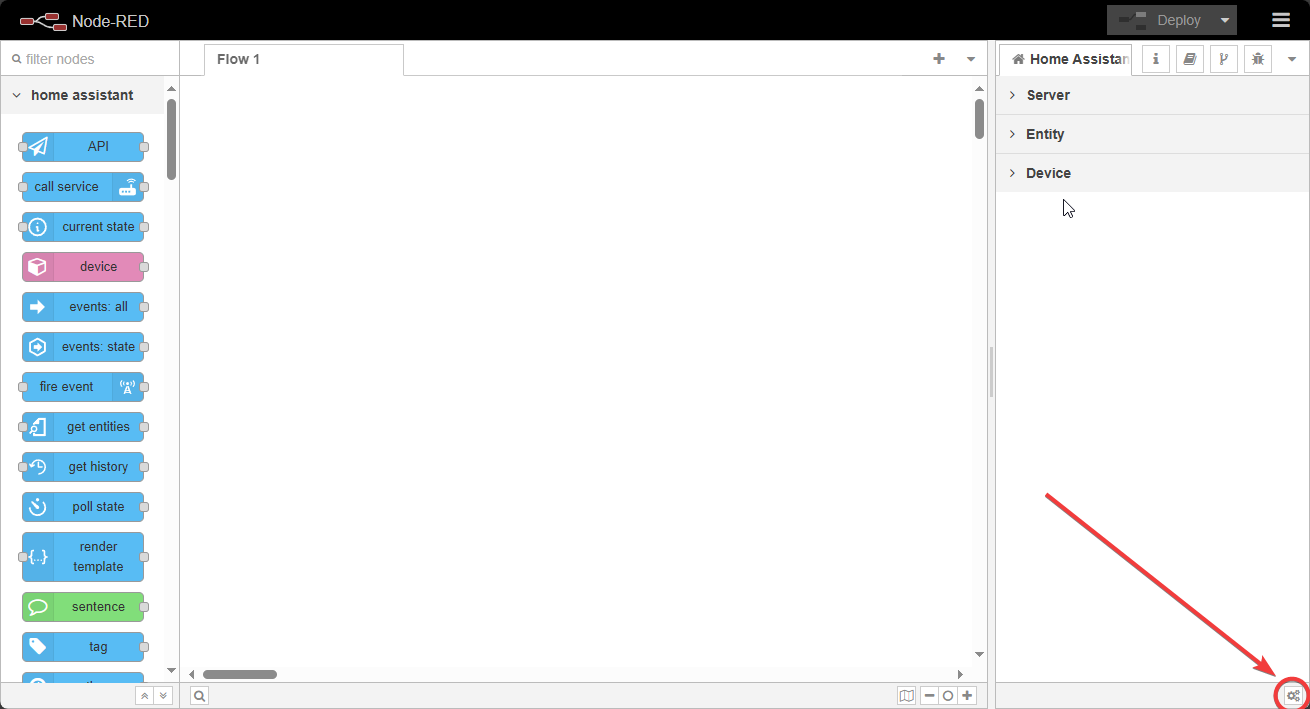
To streamline troubleshooting, a diagnostics button has been added to the Node-RED editor. This button runs a diagnostics flow and copies the output to your clipboard for easy pasting into a GitHub issue or support forum.
Note
In versions prior to 0.62.0, the diagnostics flow was available as a separate flow that needed to be imported manually. You can still access and use this flow here.
For Versions Prior to 0.62.0
Before version 0.62.0, the diagnostics flow was a separate tool for collecting runtime and system environment data. It can still be imported into Node-RED to gather essential information for troubleshooting.
Flow

You can also import this flow directly from the examples section in Node-RED:
@examples/diagnostic.json
Usage
Import the flow into Node-RED.
Deploy the flow.
Click the
Injectnode to execute the flow.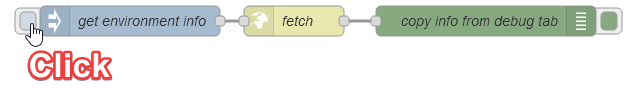
Copy the output from the
Debugtab.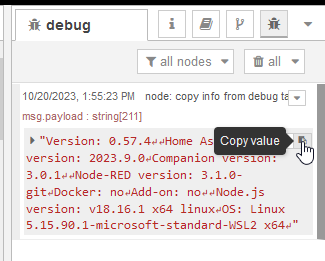
Paste the copied output into a GitHub issue or support ticket.